
Greenhouse gas emissions from livestock present a clear challenge. Yet, to be sustainable, future food systems will still require substantial animal herds. It is overly simplistic and potentially counterproductive to assume that global populations must transition to vegetarianism, or drastically restrict their meat and dairy consumption to very small amounts. Such reasoning overlooks that dietary change has only a modest impact on fossil fuel-intensive lifestyle budgets, that enteric methane is part of a natural carbon cycle and has different global warming kinetics than CO2, that the rewilding of agricultural land would generate its own emissions and that afforestation comes with many limitations, that global data should not be generalized to evaluate local contexts, that there are still ample opportunities to improve livestock efficiency, that livestock not only emits but also sequesters carbon, and that foods should be compared based on nutritional value. Such calls for nuance are often ignored by those arguing for a shift to plant-based diets.

- Situating the problem
- Global data should not be used to evaluate local contexts
- Further mitigation is possible and ongoing
- Restricting animal source foods only leads to small gains
- Dietary focus distracts from more impactful interventions
- Nutrition should not be overlooked when comparing foods
- Co-product benefits of livestock should be accounted for
- Livestock farming also sequesters carbon
- Rewilding comes with its own climate impact
- Large-scale afforestation of grasslands is not a panacea
- Methane should be evaluated differently than CO2

The overall food system contributes to 20-35% of human-caused greenhouse gas emissions. Within this, agriculture and fisheries contribute 40%, while land use/land-use change and supply chains each contribute around 30%. Livestock are the primary source of agricultural emissions, with methane from ruminants and rice alone constituting one-third of food emissions. Due to the higher emissions associated with animal-based foods compared to plants, dietary policies often focus on livestock products. The livestock sector indeed bears a substantial responsibility for climate impact and emission budgets. While some advocate for plant-based eating as a means to reduce environmental impact, the reality is more nuanced. Comparing the climate impact of single foods from animal and plant origin is not at all straightforward. All-too often, this is done in a misleading manner. Each dietary change has both positive and negative effects. A better approach is to contrast wholesome dietary patterns and evaluate the broader ecological, nutritional, and societal trade-offs.
Further reading (summary of the literature):
How much the food system contributes to global emissions?
Increasing global emissions of greenhouse gasses (GHG) are mostly driven by fossil fuel combustion [OWData 2020]. However, the food system is a main source too, estimated at some 20-35% of total human-caused GHG emissions [Vermeulen et al. 2012; Crippa et al. 2021; NASA 2021]. Three quarters of the food emissions come from 'developing countries' and China; Asia yields half of the emissions [Crippa et al. 2021]. Agriculture and fisheries provide 40% of the food emissions; land use/land-use change (LULUC; mostly in developing countries, but driven by global markets) and supply chains each generate 30% [Crippa et al. 2021]. As a part of the supply category, global food miles account for 20% of total food system emissions [Li et al. 2022]. Contribution by artificial fertilizers, for both feed and food, is estimated at 1% of the global GHG emissions [IFS 2003], but this may be an underestimate [Zhou et al. 2019].
Why is livestock primarily targeted and is this justified?
The largest part of the agricultural emissions are attributed to livestock [>80% in the EU; Peyraud & MacLeod 2020]. Of the food emissions, 1/3 is due to methane [Crippa et al. 2021]. The latter is mainly generated by ruminants, but rice also accounts for 22% of agricultural methane [Qian et al. 2023]. Since animal source foods (ASFs), and ruminant products in particular, most often have higher emissions per unit of mass or kcal than plants [Poore & Nemecek, 2018], they are a primary target of dietary policies [Grasso et al. 2021]. Climate responsibilities are thus heavily burdened on the shoulders of the livestock sector [Lazarus et al. 2021]. It has been suggested that absence of radical dietary change, including more plant-based eating, would preclude achieving the climate change targets [Clark et al. 2020]. Some even claim that eating vegan is the 'single biggest way' to reduce one's environmental impact on the planet [Petter 2018], reducing footprints with >70% [Vegconomist 2019]. Although important, addressing GHG in the livestock sector should nonetheless be done based on robust premises. Contrasting ASFs to plants is overly simplistic, as every dietary change comes with its own effects (some good, some bad). The ten arguments mentioned below need to be factored in holistically when evaluating the GHG emissions of livestock.
The broader picture
Carbon tunnel vision should be avoided when attempting sustainable dietary transitions. Gains in climate impact reduction can potentially lead to trade-offs related to other variables affected by agricultural change, such as increased water-scarcity footprints, biodiversity losses, ecotoxicity, or social harm [see elsewhere].

Argument 1
Global data should not be used to evaluate local contexts

Livestock's contribution to global anthropogenic greenhouse gas emissions is 12%, based on the latest FAO estimate. However, emission intensities vary worldwide. Global data do not reflect local contexts and should not be extrapolated when assessing the climate impact of livestock within a given region or production system. Factors like feed digestibility, genetics, climate conditions, and management practices give rise to a lot of variability. Regional differences in factors like wealth, draft power, fuel, and religious significance also contribute to differences in emission intensities.
How much does livestock contribute to global emissions?
Livestock represents 6% of the global anthropogenic GHG emissions [Mottet & Steinfeld 2018; OWD 2020]. A more comprehensive life cycle assessment (LCA) has put its contribution at 14.5%, mostly ascribed to feed production and its link with land-use change (45%) and enteric fermentation by ruminants (39%) [Gerber et al. 2013]. More recently, this estimate has been updated to 12%, of which 60% would be direct livestock emissions [using IPCC AR6, GLEAM 2023; FAO 2023], but estimates remain uncertain [BTI 2023]. Importantly, this estimate masks considerable heterogeneity globally [Gerber et al. 2013; Herrero et al. 2013]. It should be treated as such when discussing the climate impact of local systems.
To which degree do these emissions vary geographically?
Within each food type, environmental footprints can vary considerably between the least and most impactful variants [Katz-Rosene et al. 2023]. Beef displays a particularly large variability. Intensities are higher in sub-Saharan Africa and southern Asia (40-50 kg CO2-eq/kg carcass weight) than in Latin America (25 kg), North America and Oceania (10 kg), and Europe (5-10 kg) [Gerber et al. 2013; Thompson & Rowntree 2020]. Baseline measures for US beef are estimated at 21 kg CO2-eq per kg carcass weight [Rotz et al. 2019] or 43 kg CO2-eq per kg of beef [Putman et al. 2023]. To a lesser degree, such heterogeneity is also found for dairy, pork, and poultry [Peyraud & MacLeod 2020]. In the Global South, smallholder farms may lead to lower emission intensities than previously assumed, depending on productivity and herd management at farm level. About half of the smallholder farms in Kenya display milk-related emission intensities comparable to the mean within Europe, even if the median is almost double [Ndung'u et al. 2022].
What explains such differences?
Emissions are affected by variations in feed digestibility, genetics, slaughter age and weight, climate conditions, animal health, and management [Gerber et al. 2013; Herrero et al. 2013], and a different focus on wealth, draft power, fuel, and religious significance [Smith et al., 2013; Thompson & Rowntree 2020], or nutrient security [Tedeschi et al., 2017]. In Europe, low footprints are partially ascribed to the fact that 80% of beef comes from dairy animals [Gerber et al. 2013]. In the US this is less the case, even if finished Holstein cattle have half the intensity of finished beef breeds [Rotz et al. 2020]. A dairy calf has a smaller footprint because it is a by-product of milk production, while the lower footprint of a cull dairy cow compared to a finished beef breed is due to her life-long impact being allocated to milk [Rotz et al. 2019].
Argument 2
Further mitigation is possible and ongoing

How can efficiency of livestock emissions be optimized?
Global population growth is expected to increase animal protein consumption with 20% between 2020 and 2050, which represents a serious challenge [FAO 2023]. Yet, anti-livestock arguments tend to neglect that production can also become considerably less carbon intensive still [Kortetmäki & Oksanen 2020], for instance based on feed strategies, veterinary care, smart use of manure, better rotation, soil pH improvement, renewable energy use, and herd management [Gerber et al. 2013; FAO/GDP 2018; Carrazco et al. 2020; Davison et al. 2020; Peyraud & MacLeod 2020; Ndung'u et al. 2022; FAO 2023; Riley 2023]. Prioritizing improvements in productivity and efficiency throughout the production chain has the potential to reduce emissions, while still meeting the additional population-driven animal protein demands projected by 2050 [FAO 2023]. Margins are substantial for some regions of Sub-Saharan Africa and South Asia, but potential is also present in industrialized countries. In Norway, for instance, recent improvements in the pork chain have been obtained based on better genetics and management [Bonesmo & Gjerlaug Enger 2021]. Adding seaweed to cattle feed could reduce methane emissions by 82% [Roque et al. 2021], and very promising results have also been obtained with 3-nitrooxypropanol [van Gastelen et al. 2024], but more research is needed. Other options include the valorization of biogas [Xue et al. 2019; Jiang et al. 2020] and a better integration with crop agriculture [Liu et al. 2015; Lal 2020]. Stakeholders are currently developing various practices and technologies to reduce enteric methane emissions, such as the Greener Cattle Initiative [FFAR]. However, the effectiveness of mitigation strategies will depend largely on farmers’ access to services and willingness to contribute, economic considerations, and uncertainties surrounding the efficacy of certain measures [FAO 2023].
What is the role of food wastage in mitigation scenarios?
The reduction of food wastage (losses plus waste), increased valorization of meat-processing by-products, and increased consumption of offal represent additional mitigation options [Xue et al. 2019]. Cradle-to-grave emissions from food loss and waste (9.3 Gt CO2-eq/y in 2017) account for half of the total GHG emissions from the global food system [Zhu et al. 2023]. More than 1/3 of food wastage occurs at the consumption phase [FAO 2013]. In the West and in industrialized Asia, the footprint from wastage is 0.7-0.9 t CO2-eq/p/y, exceeding a global average of 0.5 t CO2-eq/p/y. In the US, avoidable food waste represents 2% of the total GHG emissions [Venkat 2012]. In UK households, >10% of meat purchases that are still safe to eat are thrown away [Taylor 2020]. Ultra-processed foods should be a particular target in such strategies, since they not only lead to up to 1/3 of all food waste in high-income countries, they are also harmful in many other ways for both human and planetary health [Anastasiou et al. 2022]. FAO's COP28 roadmap argues that per capita global food waste at the retail and consumer levels should be halved by 2030, and that all food loss and waste will need to be integrated in a circular bioeconomy by mid-century [FAO 2023].
How much reduction is achievable; what are the trends?
In its COP28 roadmap to mid-century, the FAO stated that agrifood systems need to become CO2 neutral and that gross emissions need to be cut by 25%, involving a halving of methane and nitrous oxide emissions. For animal production systems, this implies that methane emissions already need to drop by 25% by 2030, while the livestock sector's total factor productivity should grow at 1.7% per year until 2050 [FAO 2023]. These are clear targets, which can also be combined with clear priorities for intervention.Improving the production efficiency of livestock in a few developing countries would be a much more effective mitigation option than demand-side efforts; about 2/3 of the potential for methane emission reduction by 2050 could be obtained in just ten countries [Chang et al. 2021]. Also, a global 30%-reduction of all livestock emissions can be achieved if all producers would adopt the practices used by the 10% most efficient ones (or 18%, when adopting the best 25%) [Mottet et al. 2018]. In the EU27 plus UK, total agricultural emissions have already substantially decreased (by 20%) between 1990-2019 according to UNFCCC data, including methane (-21%) and N2O (-19%) emissions [Peters 2021]. For food waste, the decrease was equal to 44%, particularly driven by a drop in methane (-46%). Even if global methane emissions from ruminants has doubled from 50 to 100 Tg/y in 2012, compared to 1961, this increase mainly took place in the Latin America, Asia, the Near East, and Africa. In Europe and Russia, however, enteric methane emissions decreased with 31% and 54%, respectively, during the period 1990–2012, whereas emissions in the US remained more or less stable [Chang et al. 2019]. The Australian red meat sector considers the possibility of achieving a carbon neutral status by 2030, based on a combination of soil carbon sequestration [see below], vegetation management (trees on farm), and mitigation strategies to decrease emissions [Mayberry et al. 2019; Davison et al. 2020; MLA 2023]. Similarly, in Northern Ireland, net zero seems achievable within the target timeframes by both cutting emissions and increasing carbon storage [Riley 2023].
Argument 3
Restricting animal source foods only leads to small gains

How much net reduction at production level?
Restricting ASF production will not lead to a simple subtraction from the GHG budget, but would generate its own effects related to the filling of the nutrient gap created by a shift to more crops. As a result, removal of livestock in the US would only lead to a net GHG reduction of 2.6% in national emissions. Similarly, removing all dairy would lead to a reduction of just 0.7%. At the same time, both transitions would create domestic deficiencies in critically limiting nutrients [White & Hall 2017; Liebe et al. 2020], which is not unexpected given that ASFs are valuable sources of essential nutrition [see elsewhere].
According to an FAO projection of global mitigation scenarios for livestock emissions towards mid-century, while taking into account population growth, the contribution of dietary change based on modified consumption of meat, dairy, and eggs in accordance with dietary guidelines would be about 4%, with the bulk of the mitigation potential situated at the production side through increases in efficiencies [FAO 2023].
How much net reduction at individual consumption level?
A similar order of magnitude is found when approaching this issue at the level of Western individuals. Consider what is usually a dietary footprint of around 2 t CO2-eq/p/y in the West [Hertwich & Peters 2009; Muñoz et al. 2010; Meier & Christen 2013; Behrens et al. 2017; Arrieta & Gonzáles 2018; Crippa et al. 2021; Heller et al. 2021; Barnsley et al. 2021]. This average value may differ based on gender; for Finish males and females the dietary footprint was estimated at 1.9 and 1.4 t CO2-eq/p/y, respectively [Irz et al. 2024]. About 65-70% of such footprints comes from animal source foods [Behrens et al. 2017]. It is important to acknowledge that this contribution cannot just be subtracted from the total, as it will come with increased plant consumption, bringing in its own emissions. When accounting for this substitution, vegetarian and vegan meals would lead to -0.5 and -0.8 t CO2-eq, resp., according to systematic reviews and summary reports [Hallström et al. 2015; Wynes & Nicholas 2017], although some individual studies claim somewhat higher savings [>1.0 t CO2-eq; e.g., Arrieta & Gonzáles 2018]. A 60-% decrease in meat intake (from 200 to 80 g/p/d) would save 0.2 t CO2-eq [Meier & Christen 2013]. For the UK, specifically, the effect of a >40%-reduced-red-meat diet has been estimated at 0.5 t CO2-eq/p/y, some 3% of the total carbon footprint [Aston et al. 2012]. For the USA, halving all ASFs would save 0.6 t CO2-eq, or 0.9 t CO2-eq when beef is further reduced to 10% of the baseline [Heller et al. 2021].
Taken together and assuming, for instance, a total footprint of 12 t CO2-eq [data for France], these scenarios roughly translate into a 2-6% total carbon footprint reduction [Leroy et al. 2022]. The latter may arguably need to be adjusted to 1-3% because of rebound effects [cf. Grabs 2015], as diets low in ASF tend to be less costly in the West [Kahleova et al. 2023], potentially freeing up budget to invest in more carbon-intensive lifestyle activities. A similar reduction (2-4%) has been found for a lifetime's total reduction in consumption-based emissions when adopting a meat-substituted diet in New Zealand [Barnsley et al. 2021]. Calculations of course depend on what is considered dietary equivalence, with many ASF-associated nutrients being more difficult to obtain from restrictive plants-only diets [see elsewhere].
The effect of a 'plant-based' shift is thus not only small on a yearly basis but especially so on a lifetime of emissions. Indeed, numerous vegans and vegetarians (up to 70-80%) rapidly revert to eating meat and other ASFs, a third even within three months of their change of diet [ScienceAlert 2014; Faunalytics 2014, 2015]. Only 12 to 24% of current vegans may be in the diet for >5 years [Kerschke-Risch 2015; FCN 2018; VOMAD 2019], 7% for >10 years, and 3% for >20 years [VOMAD 2019].
How much emissions are created by plant products?
Overall, plant products tend to have lower emissions than ASFs, especially ruminant products, but not always. Some vegetarians may even have higher impacts than some omnivores [Rosi et al. 2017; Kortetmäki & Oksanen 2020], as certain plant products have elevated footprints. In the UK, this is valid for aubergines, peas, beans (3 kg CO2-eq/kg), asparagus (5), and Kenyan beans (6) [Frankowska et al. 2019a]. UK-produced tomatoes range from <1 (high-yield, seasonable), over 9 (average), to 50 kg /kg (cherry tomatoes, off season) [Berners-Lee 2010]. Mushrooms (2-3) [Robinson et al. 2019; CSS 2020], nuts (1-5) [Volpe et al. 2015; CSS 2020], grapes, pineapples, peaches, avocados (2-3), and mangoes (4) are non-negligible [Frankowska et al. 2019b]. Chocolate may be at 11 [CSS 2020] to >60 kg/kg [Poore & Nemecek 2018]. Vegetables and fruits also come with >1/3 of the food-miles emissions, which is substantial within the total food-systems emissions (20% of this total coming from food-miles) [Li et al. 2022]. However, when comparing emissions, it is needed to factor in nutritional equivalence, which is more complicated than comparing on a mass or even caloric basis [see Argument 5].
How much emissions are created by 'alternatives'?
Meat substitutes (1-6 kg/kg) have footprints that are comparable to poultry or eggs (2-6) [Nijdam et al. 2012]. 'Chicken-free' quorn, for instance, has a footprint of 3 kg/kg [Finnigan 2010], while other mycoproteins are estimated at 6 kg/kg [Souza Filho 2019]. The contribution of in vitro meat has been estimated at around 7 (3-25) kg/kg, higher than poultry and pork [Mattick et al. 2015], and not prima facie climatically superior to beef (10-150 kg/kg) because of different warming potential effects (see point 10 below for info on cattle's GWP*) [Lynch & Pierrehumbert 2019]. But according to a more recent cradle-to-gate life cycle assessment factoring in the use of fine chemicals and highly refined growth media, the impact of in vitro meat (250-1500 kgCO2-eq/kg) could even be orders of magnitude higher (4-25x) than median beef production (60 kg CO2-eq/kg edible meat) [Risner et al. 2023].
Argument 4
Dietary focus distracts from more impactful interventions
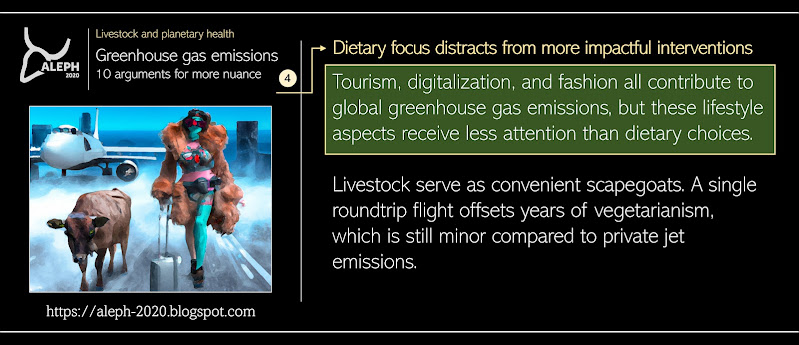
From a climatic reasoning perspective, the overall carbon footprint should remain below one's 'harm budget'. This implies that the focus should not be on single actions but on aggregates [Kortetmäki & Oksanen 2020]. Overstating effects from farming and dietary choices distracts from the more impactful emissions related to extractive Western lifestyles and their reliance on fossil fuels [Haniotis 2019]. Just 90 companies have been driving 63% of the GHG emissions between 1751 and 2010, with half of those emissions taking place after 1988 [Starr 2016]. Also, just 100 companies have been the source of more than 70% of the world’s greenhouse gas emissions since 1988 [Riley 2017].
The emission cost of cars and transportation
It is sometimes claimed, especially by animal right activists, that livestock creates more emissions than transport ("cows are worse than cars"), but this statement is erroneous [Mottet & Steinfeld 2018]. The transport sector’s 14% (IPCC data, direct emissions) cannot be directly compared to the commonly reported 14.5% figure for livestock (FAO data, LCA calculation), which moreover has been reassessed at 12% more recently [FAO 2023]. A comparison is only feasible at the level of direct emissions, which in the case of livestock are estimated at 5%. Also, living car free saves 1.0-5.3 t CO2-eq/p/y, [Wynes & Nicholas 2017], which exceeds the carbon gain for a shift to plant-based diets mentioned above (i.e. <0.8 t CO2-eq/p/y). Typical vehicles emit 3 [Belgium; DeLijn 2021] to 6-9 t CO2-eq/p/y [US; EPA 2020] depending on the country and average distances covered, with a kg CO2-eq/km load of 0.1 [EU; EEA 2018] to 0.7 [USA; EPA 2018]. For comparison, a cow emits about 1.5 t CO2-eq/y as methane equivalents [Davison et al. 2020], but this needs to be contextualized for global warming [see below].
The emission cost of tourism and air travel
Global tourism creates 8% of GHG emissions [Lenzen et al. 2018]. A roundtrip flight yields 0.7-2.8 t CO2-eq/p [Wynes & Nicholas 2017], offsetting years of veganism or decades of flexitarianism. This is still minor compared to the emissions of private jet users [up to 7,500 t CO2/y, Gössling & Humpe 2020] or superyachts [some 4,500 t CO2/y; Harding 2019], underlining a conflict between the virtue-signalling and carbon-intensive lifestyles of elites [Ahmed 2019; Catenacci 2022]; Passifiume 2022]. For instance, a celebrity told her fan base that a vegan meal a day corresponds with driving from LA to New York [Starostinetskaya 2019], while her own air travels equalled 40x the total yearly emission of average Americans [cf. Gössling 2019]. For space tourism, increasingly popular among billionaires, CO2 emissions per flight represent 50-100x the emissions of a regular long-haul airplane flight [Marais 2021]. Taken together, some 1% of the world population emits half of the CO2 from commercial aviation [Gössling & Humpe 2020]. The latter represents >2% of global GHG emissions and is on the rise, while other sectors are reducing their emissions [ICCT 2018]. Moreover, these calculations largely underestimate the effects of non-CO2 emissions [Lee & Forster 2020], which account for more than half of the aviation net forcing [EASA 2020], so that aviation causes 5% of anthropogenic warming [T&E 2020]. OXFAM [2022] has estimated that the average personal consumption emissions from a sample of prominent billionaires amounts to no less than 8,190 t CO2/y, increasing to 3 million t CO2/y when taking into account their investments.
The emission cost of digitalisation and data technologies
Increased digitalisation comes with heavy carbon costs [e.g., Energuide 2021]. Email use alone creates 0.1-0.6 t CO2-eq/p/y for professional and individual users [Berners-Lee & Clark 2010; Richards, 2018]. ICT may reach >14% of the global GHG budget by 2040 (smart phones surpassing the individual contribution of desktops, laptops, and displays) [Belkhir & Elmeligi 2018]. Communication technology (consumer devices, communication networks, and data centers) could take up half of global electricity use and up to 23% of the GHG budget in 2030 [Andrae & Edler 2015].
Other emission costs related to Western lifestyles
Various other important contributions to global GHG emissions are related to contemporary lifestyles but are hardly addressed in the public debate. Fashion generates 10% of the GHG budget [UNECE 2018; UNFCCC 2018], whereas the average person buys 60% more clothing than in 2000 [World Bank 2019]. Owning a dog or horse releases 1.0 or 3.0 t CO2-eq/y, resp. [Annaheim et al. 2019], while pet feed in the US generates 25-30% of the environmental impact from animal production [Okin 2017]. Worldwide, 1-3% of the GHGE can be ascribed to pet food [Alexander et al. 2020]. Yet, pets, fashion, travel, and smart phones receive little attention in comparison to the dietary quick-fix claims.
Argument 5
Nutrition should not be overlooked when comparing foods

Some nutrient-dense foods and beverages with higher carbon footprints offer valuable nutritional value that (partially) offsets their environmental impact. The main challenges in the global food system are not solely related to caloric efficiency but also to ensuring adequate essential nutrition. Protein and key micronutrient levels are crucial for optimal health, and many of these key essential nutrients are best obtained from animal source foods. Using CO2-eq per kg (or kcal) is not a suitable basis for comparing foods with different nutritional profiles. Applying such metrics in dietary scenarios to reduce climate impact may compromise micronutrient supply and promote ultra-processed food solutions, both of which are harmful for health. A poor status of public health contributes substantially to carbon footprints. Dietary policies aimed at reducing greenhouse gas emissions should never be nutritionally harmful or incomplete.
Further reading (summary of the literature):
Global food security should be factored in as a priority
When considering stringent climate change mitigation policies, global food security must be safeguarded. In addition to affecting consumers directly through food taxes, interventions at the production level can lead to increased costs, including higher land rents driven by land-use change. Eventually, such policies may shift demand to less expensive foods, resulting in more nutrient insecurity [Hasegawa et al. 2018]. Therefore, shifts in dietary quality resulting from carbon pricing or taxing need to be carefully evaluated. Assuming that a meat tax or dairy tax would generate a health benefit based on a decrease in chronic disease incidence, as proposed by some [Springmann et al. 2016], is not well substantiated [see elsewhere]. Moreover, views emphasizing effects on chronic disease tend to underestimate the importance of adequate essential nutrition [see elsewhere]. Most studies looking into dietary transitions based on environmental assessments do not (or not sufficiently) take into account micronutrient adequacy; if they do, the evidence suggests that the intake of zinc, calcium, iodine, and vitamins B12, A, and D would decrease, while total iron and folate would increase [Leonard et al. 2024].
Comparing foods should factor in nutritional value
The use of CO2-eq/kg in dietary scenarios is a reductionist metric that should not be used to compare foods with large differences in nutrient content. The higher carbon footprint of some nutrient-dense foods and beverages can be offset by their higher nutritional value [Smedman et al. 2010; Drewnowski et al., 2015; McAuliffe et al. 2018, 2020]. Even the common use of CO2-eq per kcal or per kg protein are poorly informative. Despite their apparent use of nutritional units, they overlook the complexity of dietary needs and optimal health [see elsewhere]. The main global food system challenges are not related to 'energy' or caloric efficiency, which is excessively and unfairly emphasized in studies that express a food's impact in CO2-eq/kcal [e.g., Poore & Nemecek 2018], but to adequate essential nutrition. The latter is determined by protein quantity and quality as well as levels of key micronutrients [Nelson et al. 2018], of which the most crucial ones are best obtained from ASFs [see elsewhere]. Even when using ‘protein’ as a unit of comparison [e.g., Poore & Nemecek 2018], it is important to incorporate its biological value (determined by its digestibility and content of essential amino acids), as this can substantially affect the outcome of the GHG comparison between foods [cf. Tessari et al. 2016; Marinangeli & House 2017; Sonesson et al. 2017; Moughan 2021; McAuliffe et al. 2023]. When also accounting for priority micronutrients (vitamins A, B9, and B12, calcium, iron, zinc), the carbon footprints of ASFs are even closer to their plant-source counterparts than what is found in protein-based comparisons, even if ASFs typically remain still somewhat higher than plant foods [Katz-Rosene et al. 2023]. A Finnish assessment has indicated that a 1/3 reduction of dietary carbon footprints may be nutritionally feasible, but that stronger shifts may cause concerns, especially for female populations and iron intake [Irz et al. 2024]. Even when comparing the same type of food produced by different production systems, nutritional content may still be an important factor. When accounting for the omega-3 fatty acid content of lamb, lower carbon footprint were obtained for grass-finished lamb than for concentrate feeds, whereas the reverse was seen in the case of a purely mass-based approach [McNicol et al. 2024].
A further shift to low-quality foods is to be avoided
Lower GHG diets tend not only to decrease micronutrient supply but also to increase the content of sugar and discretionary foods, which have their own detrimental effects [Payne et al. 2016]. Developing dietary policies that aim at reducing GHG emissions but are nutritionally harmful or incomplete should be dismissed as unacceptable [Ridoutt et al. 2017]. For instance, ultra-processed foods drive overconsumption, so that this food group shows increasing greenhouse gas emissions over time in contrast to minimally processed and processed foods [da Silva et al., 2021]. Moreover, ultra-processed foods already account for up to one third of all diet-related emissions of adults in high-income countries [Anastasiou et al. 2022]. In Sweden, "sweet, snacks, and drinks (excluding dairy)" account for 18% of the dietary emissions [Moberg et al. 2020]. This is lower than the 67% coming from ASFs in that same diet, but the latter bring in much more valuable nutrition.
Poor diets and health costs have their own climate impact
Unhealthy diets lead to enormous health costs as well as important carbon footprints [Eckelman & Sherman, 2016], the pharmaceutical industry being more emission-intensive than the automotive industry [Belkhir & Elmeligi 2019]. Moreover, obesity not only brings carbon costs related to disease but also a 20%-increase due to greater metabolic demands, higher intake of food, and higher mobility costs due to greater body weight [Magkos et al. 2019; Kortetmäki & Oksanen 2020].
Argument 6
Co-product benefits of livestock should be accounted for

When incorporating nutritional value in the assessment of animal production systems, co-products should not be overlooked, which is especially the case for liver. In lamb, for instance, co-products account for 1/4 of total edible product by weight, 1/5 of total protein, 1/3 of total fat, and almost half of the total iron content, while the liver contains more vitamin A, B9, and B12 than the carcass and other co-products combined [Wingett & Alders 2023]. In addition to nutritional value, life cycle analyses of ASFs usually neglect to equitably share portions of the emissions profile with the non-edible products and services associated with livestock production (e.g., hides, wool, fats, organs, milk, bone, serum, manure, draught power, etc.) [Alao et al. 2017; Mullen et al., 2017; Lynch et al. 2018; Katz-Rosene 2020]. For the global livestock sector, the value of animal by-products (both inedible and edible) is substantial. This is also true in the West, for beef and pork co-products in particular [Marti et al. 2011].Proper allocation is required to account for all of the functions of co-products in their various uses and markets, which is a complex task [Chen et al. 2015; Le Féon et al. 2020]. For instance, important differences are found when contrasting economic and mass allocation models, which is especially valid for beef [Gac et al. 2014]. The production of pet food needs to be carefully considered as such, with an economic allocation model being more meaningful than mass allocation (overestimation) or considering pet food as simple waste (underestimation) [Alexander et al. 2020]. Although such allocations in a multi-output system are difficult to quantify in a robust and fair manner, successful incorporation in life cycle analyses would further lower the carbon footprint of ASFs.
Argument 7
Livestock farming also sequesters carbon

Calculations of livestock’s climate impact should not only factor in carbon emissions but also sequestration. Grazing lands, which cover a vast portion of global land mass, are huge reservoirs of soil organic carbon. Adequate grassland management improves soil carbon stocks and may substantially offset emissions in regions where grazing lands dominate. 'Regenerative' agriculture practices have shown impressive results in sequestering carbon and enhancing soil fertility. Despite this potential, 'regen ag' is often ignored in conventional assessments, among other reasons due to assumptions about carbon sequestration limitations and land requirements. However, there is a large amount of degraded grassland and arable land available, which presents an opportunity for long-term carbon sequestration.
Grasslands co-evolved with grazers as massive carbon sinks
Based on accountancy methods for anthropogenic emissions, agriculture is often discussed seen as one of the most harmful sectors, whereas in reality a holistic interpretation is needed that also factors in how much carbon is sequestered [Frankelius 2020]. Grazing lands co-evolved with herbivores and act as massive reservoirs of soil organic carbon (10-30% of the global total) [Schuman et al. 2002; Kleppel 2020]. Their vast expansion over 40 million years, covering almost half of the land mass [Zimov 2005], may even have induced global cooling and Pleistocene glaciation [Retallack 2013]. At the Holocene boundary, however, megafauna extinction (likely due to overhunting) led to a shift from the 'mammoth steppe' to tundra [Zimov et al. 1995], while impacting on the methane budget [Zimov and Zimov, 2014; Smith et al. 2016]. More recently, the once immense and highly fertile North American prairie was reduced from 3.6 million-km2 to a mere 1-2% after European interference, land conversion, and decimation of the bison. Nonetheless, the soils that developed under these prairies still contain >1/3 of the soil carbon in the continental United States [Mackelprang et al. 2018].
Even today, emissions by ruminants are at least partially offset in regions where grazing lands are the dominant biome. Because proper grassland management improves soil carbon stocks [Conant et al. 2017], offsetting of emissions can be high in regions where grazing lands are a dominant biome [Viglizzo et al. 2019]. In the Welsh uplands, a drop from 12 to 9 kg CO2-eq/kg beef is obtained when accounting for sequestration estimates [Hybu Cig Cymru 2020]. In South-West Spain, sequestration offsets by soil and vegetation (trees) ranged from 54% to 95%, sometimes even resulting in negative carbon footprints [Reyes-Palomo et al. 2022].
Sequestration in grasslands is context-dependent
The sequestration process is based on photosynthesis (via vegetation) and carbon storage in soils [Kleppel 2020]. The latter is driven by complex interactions of above-ground herbivory, saliva, dung and urine, and below-ground biology (involving fine root exudates and microbial biomass) [Merill et al. 1994; Bardgett et al. 1998; Wilson et al. 2018]. As a result, gains are seen in topsoil, fertility, and forage biomass [Gullap et al. 2011; Franzluebbers et al. 2012; Hillenbrand et al. 2019]. Soil thereby acts as an extended composite phenotype of a resident microbiome, responsive to organic inputs [Neal et al. 2020]. Climate change mitigation strategies should factor in this interplay between soil biology, vegetation, grazers, and predators. This also implies, however, that carbon stocks may deplete in the case of harmful grazing management and grassland degradation [Ganjegunte et al. 2005; Chang et al. 2021; Beilllouin et al. 2023]. Success depends on the effectiveness of microbially-mediated and soil-dependent micro-structure remodelling. For instance, plant diversity seems to be an important factor [Yang et al. 2019] and managerial adjustment is needed for different regions [McSherry & Ritchie 2013].
The carbon potential of grazing may be undervalued
FAO's COP28 roadmap argues that 10 Gt of CO2eq of additional carbon will need to be sequestrated in croplands and pasture soils between 2025-2050, while agrifood systems will become a net carbon-sink (-1.5 Gt CO2eq/y) [FAO 2023]. It is unlikely that soil carbon sequestration will be able to fully offset all livestock emissions at a global scale [to totally offset the current level of methane and nitrous oxide emissions for the next 100 years, 135 Gt of carbon would need to be stored in global grasslands; Wang et el. 2023]. 'Regenerative grazing' is portrayed by some as a global solution to offset carbon emissions from agriculture, and beyond, but often hyperbolically so and with insufficient attention to contextuality [Giller et al. 2021]. However, where conditions allow it, some management systems lead to substantial carbon sequestration that can at least partially offset emissions [Allard et al. 2007; Beauchemin et al. 2011; Teague et al. 2016; Assouma et al. 2019]. In Northern Ireland, a pioneering auditing programme has shown the potential of improved soil and above-ground carbon stocks to lead to net zero emissions, with some farms already being negative emitters [Riley 2023], with preliminary data also coming from Australia [Barker et al 2022]. Such potential was unlocked through a combination of better genetics and animal health, the use of multispecies swards and legumes, correcting soil pH, improved rotations, silvopastoralism, the planting of trees and hedgerows, and renewable energy use. On US rangelands, grazing management increases soil carbon with 0.1-0.6 t C/ha/y [Schuman et al. 2002; Conant et al. 2003; Liebig et al. 2010; Pelletier et al. 2010; Lupo et al. 2013], but rotation systems have even reported rates of 2.3 [multi-species; Rowntree et al. 2020] and 3.6 t C/ha/y [beef cattle; Wang et al. 2015; Stanley et al. 2018]. Starting from degraded cropland, this can be up to 8.0 t C/ha/y [Machmuller et al. 2015].
Criticism of regenerative grazing is too pessimistic
Despite promising results, carbon sequestration enhancement by grazing management techniques, whether or not of the 'regenerative' type, is ignored in conventional assessments. This is partially due to a lack of data and due to a downplaying of the potential, based on (1) the fact that more land may be required [Stanley et al. 2018; Rowntree et al. 2020], (2) the assumptions that carbon sequestration is a time-limited benefit [Wang et al. 2023] and that soils are generally in a long-term equilibrium of near-zero sequestration [Viglizzo et al. 2019], and (3) the higher methane emissions for grass-only cattle compared to those finished on grain because of differences in feed digestibility [Lupo et al. 2013; Heflin et al. 2019]. Although these limitations need consideration, they are often overstated:
The 'limited land' argument. It is true that extensive grass-based husbandry would lead to more land use than intensive options, despite their lower reliance on crop land for feed. However, a lot of degraded lands with a herbivore deficit are available still for soil carbon sequestration, which can be done through the restoration of grasslands [Yang et al. 2019; see also elsewhere]. These soils are currently unsuitable for efficient cropping, and are often degraded to such an extent, that their long-term sequestration potential may provide the best opportunity to reduce the footprint of ruminants [Rowntree et al. 2020]. While conversion of grasslands into arable land leads to rapid carbon losses [Beilllouin et al. 2023], mainly in North America, Europe, and South Asia [Chang et al. 2021], the inverse action indeed leads to more carbon in the surface and deeper layers, meanwhile enhancing soil fertility [Powlson et al., 2011; Conant et al. 2017; Mathew et al. 2017; Minasny et al. 2017]. Moreover, the increased land demands for regenerative grazing can at least partially be compensated for by higher stocking densities (livestock units/ha) needed for adaptive rotational mob grazing. The degree of change in stocking density is uncertain but may reach 30% [Hillenbrand et al. 2019] to 50% [Cunningham 2021].The saturation argument. This overlooks the biology-driven sequestration at the deep horizons of the soil, e.g., up to 1 m [Wei et al. 2012; Riley 2023], and the fact that additional topsoil can be formed. Although sequestration in the top 30-cm of soil is important and usually assessed experimentally, it contains only 40-50% of total stocks on average, with grasslands exceeding that average because they have deeper perennial roots than crop lands [JRC 2012]. The formation of the relatively long-lived mineral-associated organic carbon (MAOC) is key to this debate. No detectable upper limit of MAOC seems to be present in temperate agricultural soils, contradicting the common belief that soils are limited in their ability to accumulate MAOC by the amount of clay and silt particles present [Begill et al. 2023]. The scientific literature seems to lag behind what is being achieved by farmers on the ground [e.g., 30 cm of new topsoil built directly on top of a gravel and sand layer, in 10 years, Williams 2018] and what is being achieved in the Irish 'Heartland' [Irish Times 2023] and Australian 'RCS/Carbon Link' programs Barker et al 2022].The 'higher emissions' argument. As far as the higher methane emissions of grass-only cattle due to their lower efficiency are concerned [Thomas et al. 2021; Blaustein-Rejto et al. 2023], nuance is once more needed [Kleppel 2020; Rowntree et al. 2020]. The argument is usually correct, but overlooks the fact that grass-fed systems come with many other advantages, such as lower feed inputs in extensive systems compared to conventional ones [Reyes-Palomo et al. 2022]. Grain feeding comes with its own trade-offs, increasing fossil-fuel derived CO2 emissions that have a more lasting impact on global warming than methane [Picasso et al. 2014; see point 10 below]. In the broader context of this discussion it is also important to bear in mind that grain-finished cattle spend a substantial (and sometimes most) of their lives on grass too [e.g., CSIRO 2022], so that their management can in principle be combined with a 'regenerative' component.
For a science compendium on well-managed grazing, see: Soil4Climate 2023
Explanatory video 💬 Williams 2024
Argument 8
Rewilding comes with its own climate impact

Discussions on dietary greenhouse gas emissions often refer to carbon savings through rewilding and afforestation. However, these scenarios tend to underestimate the above-mentioned role of grasslands as carbon sinks as well as the emissions associated with rewilding itself. Climate benefits of rewilding scenarios should not be overstated. They replace livestock with animals that are also methanogenic. Moreover, the wild fauna can affect forest carbon sequestration through browsing. In many regions, current levels of livestock methane may not be all that different from natural baseline levels.
Opportunity costs?
Discussions on dietary GHG emissions extend to the notion of missed 'opportunity costs', i.e., carbon saving via rewilding and afforestation [Searchinger et al. 2018; Hayek et al. 2021]. Besides the fact that land use change is approached simplistically [see elsewhere], and the fact that the carbon removal potential of nature restoration and land removals to reduce peak global temperatures is minor [Dooley et al. 2022], such scenarios underestimate the role of grasslands as carbon sink [see above, Argument 7] and the fact that rewilding comes with its own emissions (via the digestive processes of wildlife or, more directly, via decomposition of plant matter).
Wild animals also have an impact on carbon budgets
In rewilding scenarios, livestock would be replaced by other methanogenic animals, at least partially, which are moreover less efficient feed converters [Manzano & White 2019]. Also, wild animals can diminish forest carbon sequestration because of browsing, as has been argued for moose in Norway, even if part of it can be offset because of albedo effects [Salisburry et al. 2023]. As a result, rewilding effects on GHG emissions may not be all that high as expected. This point is underlined by the fact that current levels of enterogenic methane production are not very different from the historical/natural ones produced by wild animals, such as termites, deer, elk, or bison (pre-European settlement in the US), and especially when compared over a larger time span to Paleolithic megafauna [Doughty & Field, 2010; Hristov 2012; Zimov and Zimov, 2014; Smith et al. 2016]. Even more recently, warming potential caused by livestock increases since the mid-19th century has been partially balanced by a cooling from a reduced number of wild grazers [Chang et al. 2021].
Not all livestock emissions are 'anthropogenic'
Both Late Pleistocene and pre-industrial natural herbivore levels are likely to be underrated and may have been consistently higher than generally assumed [see elsewhere], which lead to misoriented sustainability policies [Manzano et al. 2023a, 2023b]. The existence of ecological herbivory baselines in 'open' ecosystems, also within the natural European temperate forest biome [Pearce et al. 2023], implies that the current emissions by domestic herbivores should not be seen as exclusively 'anthropogenic' as these animals are replacing the wild herbivores of the past. Therefore, ecosystem baselines must be included in the environmental assessments of livestock [Manzano et al. 2023a, 2023b]. In Spain, for instance, a minimum baseline equivalent to 36% of current grazing livestock biomass and 23% of their enteric methane emissions needs to be taken into account [Serrano-Zulueta et al. 2023]. Factoring in natural baselines, coupled to a reduced need for external feed, puts the carbon footprint of transhumant lamb meat below the level of intensive lamb production systems in Spain [Pardo et al. 2024].
Argument 9
Large-scale afforestation of grasslands is not a panacea

Deforestation is partially driven by livestock expansion and contributes to climate change. Carbon emissions from deforestation to pasture are mostly found in South America (70%) and East and Southeast Asia (21%) [Chang et al. 2021]. As this is environmentally harmful, reforestation should be considered where relevant. Some authors, however, want to go further and argue for massive global afforestation programs. Although this indeed holds high theoretical potential in carbon sequestration [Searchinger et al. 2018; Bastin et al. 2019; Hayek 2020], in practice this is not only unrealistic but may also lead to harmful outcomes, such as a dramatic decrease in biodiversity and ecosystem services [Veldman et al. 2015]. In New Zealand, the logic of carbon credits has created a detrimental shift from sheep farming to forestry, under the form of pine tree monocultures [McClure 2023].
Forests are not always the most reliable ecosystems, prone to large forest fires in Mediterranean and semi-arid climates [Dass et al. 2018], and vulnerable to climate change [Choat et al. 2012]. Their sequestration advantage may not be effective until decades or centuries and even result in a transitory net loss [Poeplau et al. 2011; Friggens et al. 2020], whereas classic forest management may on some cases not be effective at all [Naudst et al. 2016]. Satellite analysis in California, for instance, has shown that forest offsets may not be doing much for the climate [Coffield & Randerson 2022; Coffield et al. 2022]. Worse, the changes in albedo and increase in aerosol scattering that are caused by afforestation can substantially outweigh the carbon storage benefits, sometimes up to a third of the CO2 removal or even creating a net warming effect [Kirschbaum et al. 2011; Weber et al. 2024].Conversion of grasslands to forest lands does not necessarily lead to gains in soil organic carbon, although this is of course dependent on the local context [Beilllouin et al. 2023]. Grazing livestock sequesters carbon at a similar rate of afforestation (0.5 t C/ha/y during the first two decades) [Peyraud & MacLeod 2020], but rates can be higher [see above]. Also, assessment of the deeper layers is crucial when comparing forests and grasslands. Although carbon storage increases sharply in the top 30 cm of secondary forest soil, mainly due to surface litter, effects in grasslands also take place at deeper levels (> 1 m), due to higher carbon input from roots [Wei et al. 2012].Although region-dependent, restoring grasslands can be more effective where soil depth and climate allow it. Whereas forests in temperate zones sequester 60-80 t C/ha above ground and 100 t C/ha below, grasslands store up to 100-300 t C/ha [Alonso et al. 2012]. As below-ground sinks, they are also more reliable in regions vulnerable to wildfires [Dass et al. 2018; Stevens & Bond 2023]. In the UK, a decrease in soil carbon with concomitant GHG release would be obtained for any change from permanent grassland to other use, incl. conversion to arable land (-9.3 t CO2-eq/h/y) or forestry (-2.3) [Smith et al. 2010].Woodland cover can - and should - be strategically increased by integrating it within farms, rather than by displacement [Hybu Cig Cymru 2020; Riley 2023]. Agroforestry, and other discrete tree planting options, would be more resilient to fire and climate change, hold more biodiversity, and effectively sequester carbon without necessarily suppressing livestock [De Stefano & Jacobson 2017; Prevedello et al. 2017; Assouma et al. 2019]. Traditionally inspired agricultural systems that combine animals and plants synergistically may further enhance yields and ecological benefit [Plexida et al. 2018; Khumairoh et al. 2018]. Livestock grazing can also be an effective tool against forest fires [Lasanta et al. 2018].In the Spanish Dehesa agroforestry system, carbon sequestration in both trees and soils offset 54% and 95% of the GHG emissions on conventionally and organically managed cattle farms, respectively; in some cases, even leading to negative carbon footprints [Reyes-Palomo et al. 2022]. In Ireland, the ongoing 'Heartland' project has shown that hedges have 50% greater carbon density than woodlands [Irish Times 2023]. Depending on the source, woody vegetation on New Zealand's sheep and beef farms offsets 30% (18-50%) [Ministry of the Environment 2021; Mazzetto et al. 2023] to 90% (63-118%) [Case & Ryan 2020] of the on-farm agricultural emissions. Most vegetation on farms does, however, not meet the definition of a forest, and does not qualify for inclusion in national inventories. Yet, it would only be fair if farmers get credit for their sequestration.
Explanatory video 💬 del Prado & Manzano 2023
Argument 10
Methane should be evaluated differently than CO2

Disproportionally targeting ruminants is simplistic
Ruminants lead to higher GHG emissions than other livestock categories due to the production of methane, which is a more potent GHG than CO2 [Eshel et al. 2014]. The usual data for beef or lamb (10-150 kg CO2-eq/kg of food) are indeed higher than for pork (3-10) or poultry (2-6) [de Vries & de Boer 2010; Nijdam et al. 2012; Röös et al. 2014; Apostolidis & McLeay 2016; Jiang et al. 2020; Bonesmo & Gjerlaug Enger 2021] or saltwater fish (2-3) [CSS 2020]. However, there are several reasons to caution against a simplistic replacement of ruminants. In fact, partially switching global livestock production from monogastric animals to ruminants could lead to lower emissions of nitrogen and GHG (due to land use change and release of cropland for feed), and less feed-food competition [Cheng et al. 2022]. In addition, it is important to factor in farm management [Nijdam et al. 2012], and adjust for the nutritional value of each meat type [McAuliffe et al. 2018]. Crucially, comparisons between animal categories based on the global warming potential (GWP) of different meats need to be done cautiously because of key differences in atmospheric kinetics between methane and CO2.
Methane and CO2 require different accountancy
For many climate impact assessment purposes, methane should be treated differently than CO2 when assessing its global warming potential. To do so, the GWP* accountancy system has been developed [Allen et al. 2018; Cain et al. 2019; Lynch et al. 2020]. The choice of the GWP vs. GWP* framework has important effects on the outcomes. Since GWP* has a dynamic nature and a strong correspondence with climate models, it provides the most complete coverage of the temporal evolution of temperature change for different GHG emissions [McAuliffe et al. 2023]. In contrast to CO2, which is a long-lived stock pollutant that accumulates in the atmosphere and generates warming, methane is a short-lived flow pollutant. However, methane is also 30x more potent than CO2 (over the span of a century) and its atmospheric concentration has more than doubled in the last 200 years, being responsible for 20% of global warming since the Industrial Revolution [NASA 2021]. Yet, whereas CO2 originates mostly from the mobilization of fossil carbon that took millions of years to form, methane from the enteric digestion by ruminants is part of a biological cycle which does not bring in new carbon (provided there is no increase in emissions, as could be caused by increasing herd sizes).
Stabilized herds do not cause global warming
Slightly reducing the herd’s methane emissions (0.3% per year) would imply zero CO2-warming-equivalent emissions and, thus, not cause further global warming at all in aggregate. Going beyond that may even induce cooling. In the UK, for instance, total agricultural emissions under GWP* would be just 20% of the GWP-based value, due to a considerable drop of methane over the last decades [Costain 2019]. Calculated for 2016, British emissions would thus drop from 46.5 MtCO2eq to 9.5 MtCO2eq* because methane levels have fallen since the base year of 1996 (leading to a negative value of -10.6 MtCO2eq*), while CO2 and N2O across that period have remained roughly the same. A study from New Zealand estimated the carbon footprint of sheepmeat and beef below 15 and 22 kg CO2-eq per kg of meat, respectively, when taking into account sequestration and using GWP100, but found that sheepmeat is climate neutral and beef is heading in that direction with GWP* (for 1998-2018) instead [Mazzetto et al. 2023]. In Ireland, a combination of mitigation measures with GWP*-based assessments would help farmers to account for methane-associated warming without compromising on productivity; a 1-% yearly reduction during a decade followed by no change would remove 38.8 MtCO2eq by 2050 for all Irish livestock [McKenna & Banwart 2024].
As argued above [Argument 2], achieving a reduction in methane emissions is not wishful thinking. There is ample potential for mitigation of biogenic methane from livestock in global food systems. In the EU27+UK, for instance, total methane emissions have decreased with 40% between 1990 and 2019, with a 21-% decrease for agriculture [UNFCCC data; Peters 2021], corresponding with a 1.4-2.8 Tg/y decrease between 2000-2006 and 2017 [Jackson et al. 2020]. In the US, where livestock contributed to 10% of methane emissions in 2015 [NASA 2021], agricultural methane has stabilized although total methane increased due to fossil fuel industries [Jackson et al. 2020]. Globally, methane emissions nevertheless remain a challenge, as Europe is the only continent whose methane emissions have been decreasing during that period [NASA 2021]. To which degree this challenge relates to global livestock production, and how much mitigation within animal agriculture can still be envisaged, remains the topic of debate.
Explanatory videos 💬 del Prado & Manzano 2019; 2023; CLEAR 2020; BAMST playlist
What explains the current increase in global methane?
The global cattle population has not been increasing during the last decade [Shahbandeh 2020]. The steepest recent increase in cattle was between 2000 and 2006 [FAO], when methane levels were flat. Part of the post-2007 surge and post-2014 acceleration in global methane may be due to a relative increase in herd sizes in regions with low efficiency, but also to various other causes, incl. geological and fossil fuel emissions (shale gas), landfills, wetlands, and rice farming [Gramling 2016; NASA 2016; Nisbet et al. 2016; Alvarez et al. 2018; Rasmussen 2018; Etiope & Schwietzke 2019; Howarth 2019; Jackson et al. 2020; Malik 2021; Bieldvedt Skeie et al. 2023; Qian et al. 2023; Carrington & Clarke 2024]. For instance, methane leaks from Turkmenistan’s two main fossil fuel fields caused more global heating in 2022 than the entire carbon emissions of the UK [Kayrros data; Carrington 2023]. Also, highly variable aquatic ecosystem sources may have been underaccounted for (i.e., flooded rice paddies, aquaculture ponds, wetlands, lakes, and salt marshes), and may represent half of the global methane emissions [Rosentreter et al. 2021]. Alternatively, it has been suggested that higher methane levels are due to weakening sinks in the soil and, especially, in the atmosphere (i.e., hydroxyl radical levels, affected among others by CO emissions) [Turner et al. 2017; Cheng & Redfern 2022; Wang et al. 2022; Bieldvedt Skeie et al. 2023]. The interplay between hydroxyl radical levels and CO in the coming decades will therefore influence methane's future climate forcing [Liu et al. 2024].